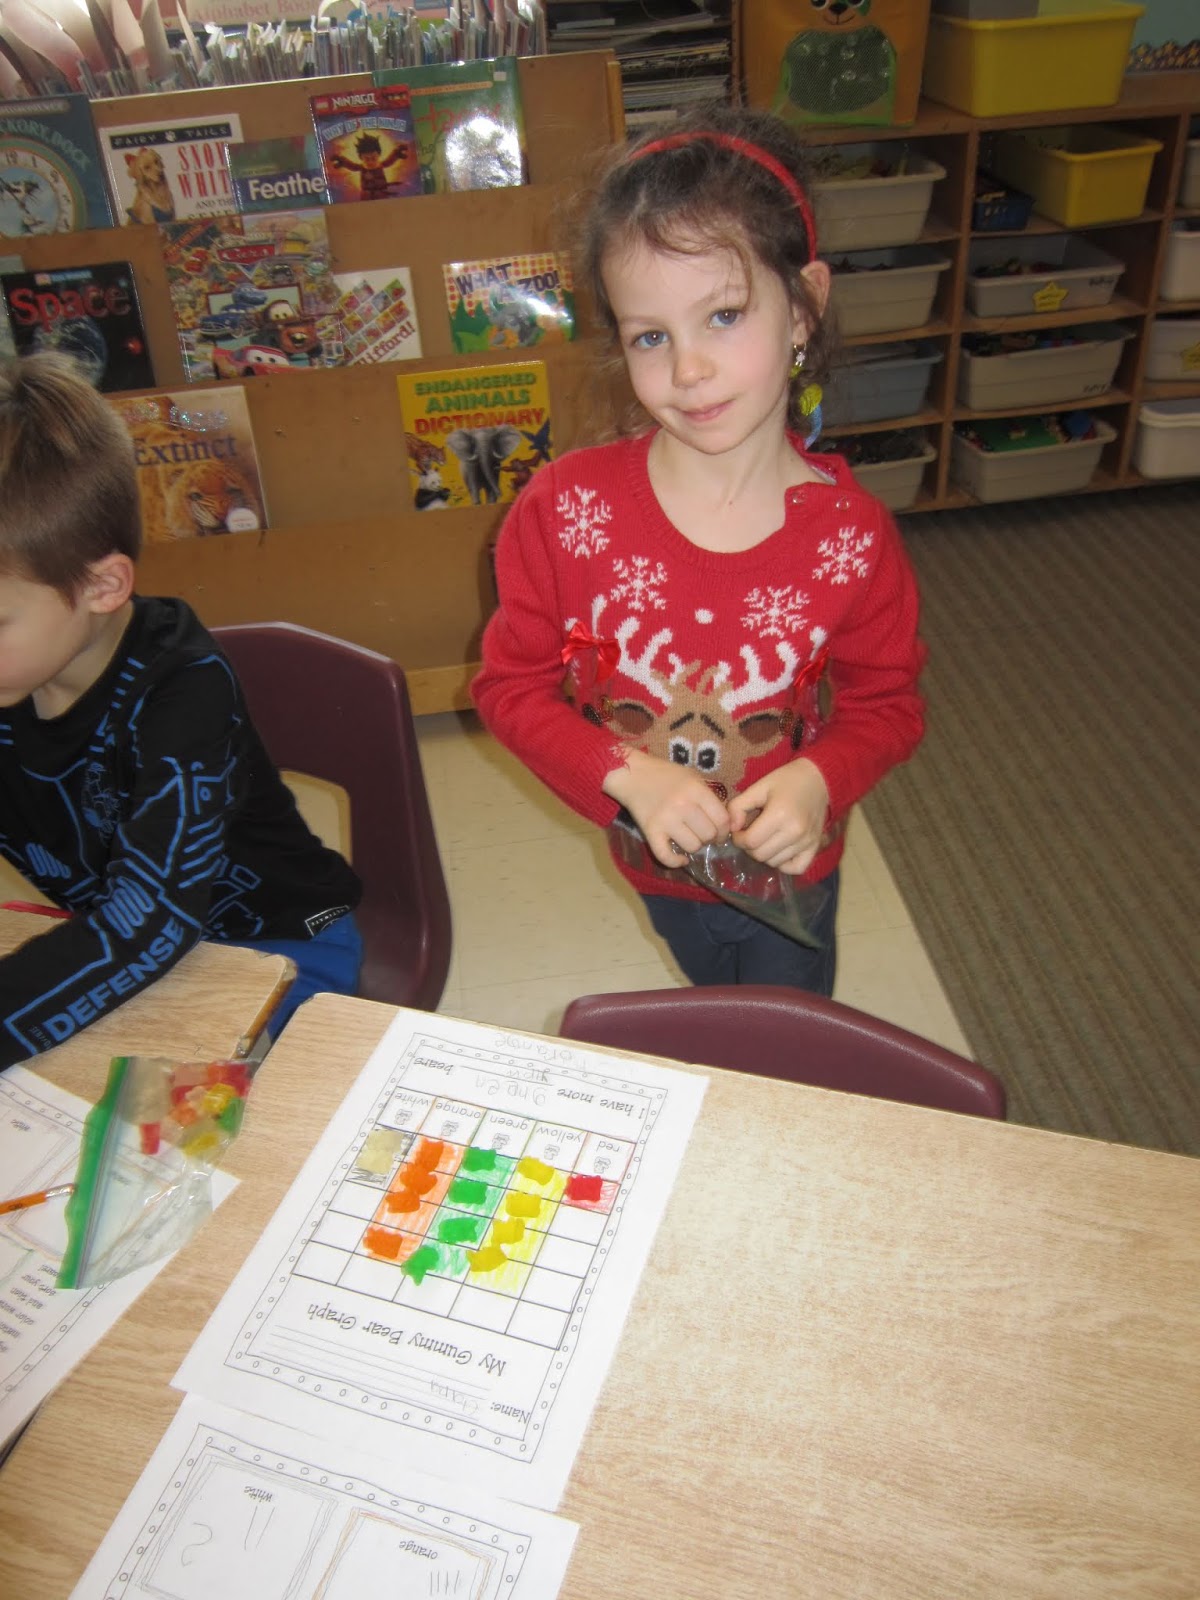
Our Gummy Bear graphing activities included sorting gummy bears by colour, counting and recording the number of gummy bears in each group and representing that number in tally marks, creating a concrete graph using the gummy bears, and then transferring that data onto a bar graph. Students were able look at their bar graph and determine which colour group had the most gummy bears and which colour group had the least gummy bears. Students enjoyed eating their gummy bears once their graphing activities were completed.


A special shout out to Malcolm who took the initiative to sort his Halloween Treats into groups and then tally the number of treats in each group. Malcolm brought in his data collection from home to show the class and we had fun analyzing his data.

No comments:
Post a Comment